
Congressional Realignment Released For Next Decade, California Down a Seat
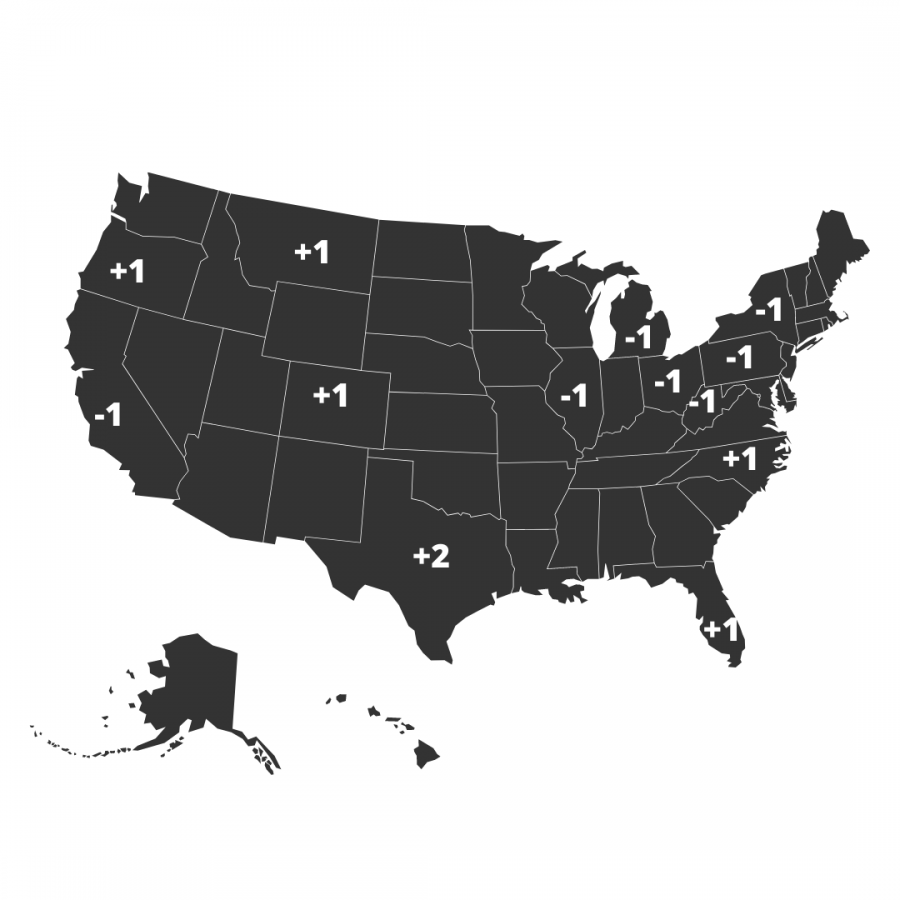
In the final week of April the United States Census Bureau finally released congressional configuration numbers. The map above shows which states gained and lost seats in the House of Representatives. It is apparent from the map that the southern and western United States are gaining population while the midwest and northeast are both losing population.
May 3, 2021
After a year of delayed results and adversity the United States Census Bureau has finally released the new Congressional distribution numbers for the next decade. After the count of every United States citizen 13 states are set to gain or lose representation in the US House of Representatives.
The states that gained influence in federal politics came mostly from the southern, sun-belt region of the country. Colorado, North Carolina, Montana, Florida and Oregon all gained a seat, and Texas, the fastest growing state in the country gained two seats.
The stagnant growth in the upper midwest and northeast was apparent as New York, Michigan, Illinois, Ohio, Pennsylvania, and West Virginia all lost a representative.
California will also be losing a seat for the first time in its history as a state. This is a result of California’s population increasing at a rate of 6.1 percent over the past decade, compared with the national average at 7.4 percent.
If there is any lesson to be learned from this census’ results it is that simply filling out one’s census document can potentially have huge impacts on elections and congressional configurations. New York only needed to count 89 more residents to fill out the census form to keep their 27th district, this is the closest margin for deciding district configuration in the modern census era. Only Oregon had a close call in 1970 when they needed 231 more residents.
The district will likely be taken out of upstate New York which will lead to an entirely new map, which will have an impact on New York’s House of Representative members after the 2022 midterm elections.
The most imminent issue is how the loss of a district in California will affect redistricting efforts and possibly leave certain constituents with a different representative. It is important to note that California’s population did increase over the past decade, but with the House of Representatives capped at 435 members, slow growth can also lead to loss of representation.
Regardless, 14 individuals on the state’s independent redistricting commission will now decide where to draw the remaining 52 districts. The most important pieces of information in deciding how districts are drawn are overall population reapportionment levels and community level demographics.
The independent commission will also listen to the voices of constituents who wish to remain represented by a specific member. If you are a constituent of Mike Levin, Katie Porter, or Michelle Steele you can write to California’s redistricting commission to remain as such.
The redistricting process in California is certainly unique, but it will be over by early next year. At that point campaigns will start up and it will be time for another election cycle.